Introduction
Observation: Any fact or data that is obtained by using one of the five senses. Observations are impartial. Note: measuring something is an observation by comparing to a standard.
Inference: An opinion, conclusion, or prediction based on data.
Measurements Length is measured with a meter stick and has units of meters, centimeters or millimeters. Area is length x width and the units are cm2. Volume (units are cm3 for solids and mL for liquids)
Mass measures the amount of matter in an object.
Density measures the amount of matter that is crammed into an object. density = mass/volume
YouTube video showing how density changes as you change the density of a pillow. |
|
||
|
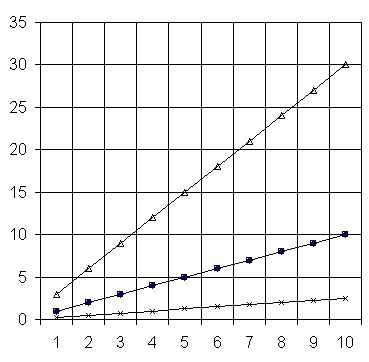
Direct relationship- as x gets bigger, y gets bigger. For example, the relation ship between age and size (until maturity) is a direct relationship.
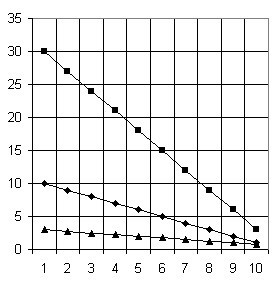
Inverse- as x gets bigger, y gets smaller. For example, the relationship between time spent at the mall and the amount of money in your pocket is an inverse relationship.
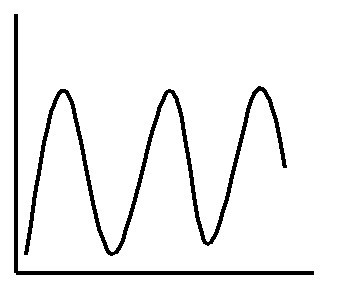
Cyclic- a repeating pattern. Most relationships in Earth Science are cyclic.
Independent- x has no effect on y. This will be a straight, horizontal line and it means that one variable has no effect on the other.
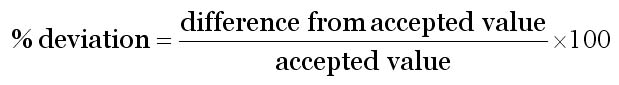
Percent Deviation (or "percent error") describes how wrong a measurment is.
|
|||
|
|||