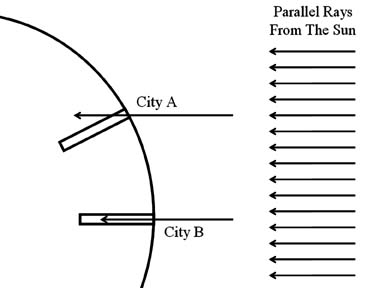
Since he was an old Greek dude, and as everyone knows Greece and Italy are very close, Eratosthenes knew alot about pizza.
"What does this have to do with pizza?”
Well, Tonto, if you know the angle of one slice of pizza, you can tell how many slices will fit in a pie.
For example:
If you have a slice that measures 45 degrees,
well 360 degrees divided by 45 degrees will give you 8 slices.
Now in order to calculate how big around the pizza is, all you have to do is multiply 8 times the length of pizza crust on one slice.
And this is the formula he used:
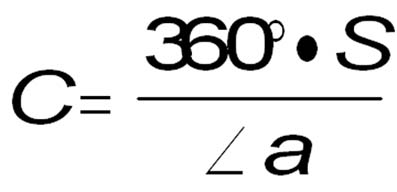
Where:
C = the circumference of the circle
S = the surface distance between cities
a = the angle (shadow or from Earth’s center)
Voila! Or should I say Eureka!
The old Greek guy climbed (clumb?) into the well, hung by his toes and measured the angle of the sun's shadow.
Knowing his geometry, he knew that the shadow’s angle was equal to the angle from the center of the Earth to the two cities.
“Alternate interior angles”
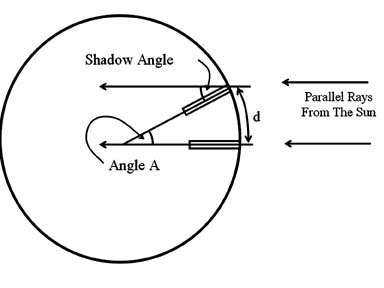
Eratosthenes was old, wore sandals and they didn't invent the horse yet so he couldn't measure the distance between the two cities himself.
So he asked his neighbor if he could borrow his son for a little while...
He gave the kid a quarter and the kid walked the distance from one city to the other and kept count of how many paces.
When the kid came back, Eratosthenes gave him the quarter and calculated the circumference of the Earth.
Roundness of the Earth
Lab 1-2 Shape of the Earth

From: Explorations in Earth Science- Osmun ,Vorwald, & Wegner
Roundness-Ratio=Polar Diameter/Equatorial Diameter
Perfect Sphere equals a roundness ratio of ONE!
Average Diameter of Earth=(Polar Diameter + Equatorial Diameter)/2
To find out whether or not Mt. Everest is constructed to scale on the relief diagram (on page 41), you must calculate the proportion below:
Actual height of Mt.Everest/Earth Diameter
=
Relief Diagram height of Mt. Everest/Diameter of Relief Diagram
The Earth appears perfectly smooth from space. Even the highest mountain (Mt. Everest) is so small compared to the entire size of the Earth that the bump would not be seen from space.
From space, the appearance of Earth is so perfect that an accurate model would be a billiard ball since it is so close to a perfect sphere and almost perfectly round and smooth.
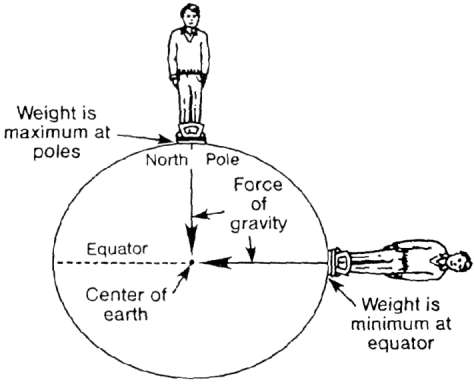
You can also indirectly measure the oblateness of the earth with gravity measurements.
Latitude & Longitude
Latitude- how far N or S you are
Polaris- the North Star
Equator- the place halfway between N & S poles
Geographic pole-place where the Earth’s axis of rotation meets the surface.
Longitude- how far you are E or W from the Prime Meridian.
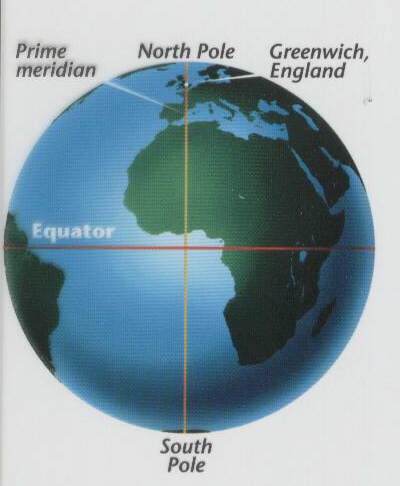
Longitude is the degrees East or West of the Prime Meridian.
The Prime Meridian runs through Greenwich, England because that is where the coordinate system was invented.
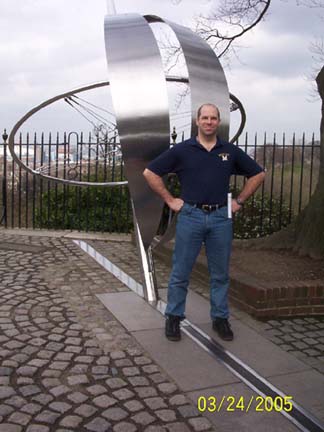
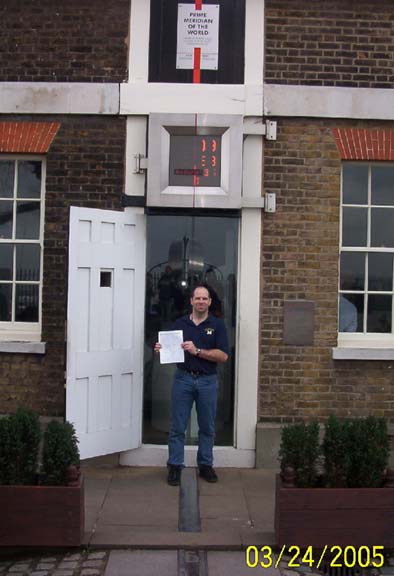
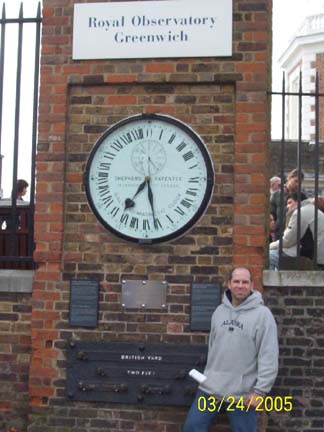
These two pictures show Medina (above) in Greenwich standing at the Prime Meridian. (Notice the Reference Tables!)
Time Zones
Local solar time (the time according to the position of the sun) varies greatly as you travel East and West. Time zones were invented so that people in local areas can agree on the same time.
The Earth's structure is layered.
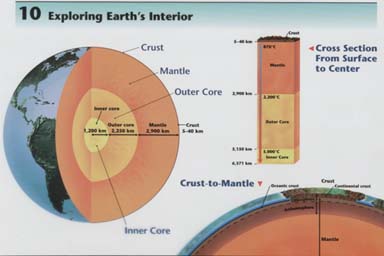
Each layer is called a “sphere” since it wraps around the ball of Earth.
The lithosphere is the "rock layer" of the Earth.
See the Handy Dandy Earth Science Reference Tables
Page 11& Page 14
The hydrosphere is the "water layer" of the Earth.
The atmosphere is the "air layer" of the Earth.
The atmosphere and hydrosphere are so thin compared to the entire size of the Earth that, if drawn as seen from space, the ink would be thicker than each of the two layers would be if drawn to scale.
Maps
Contour maps show the shape of the land by drawing lines that represent equal altitudes.
An isoline is a line connecting points of equal value.
Examples of isolines:
- Isotherms: points of equal temperature
- Isobar: points of equal barometric (air) pressure
- Contour: points of equal altitude
- Concentration of chemicals
- Anything else you can get a value for
- (The weather channel loves isolines!)
Rules for drawing isolines
- Isolines connect points of equal value.
- Isolines are gentle, curving lines- no sharp corners.
- Isolines are always closed curves even though the map might only show part of it.
- Isolines NEVER cross- this would mean that one point has two different values.
Ex: one spot has two temperatures?
- Isolines usually are parallel. (They have a parallel trend.)
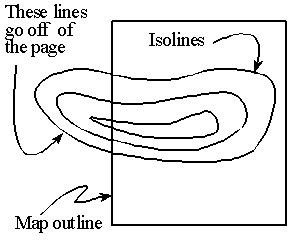
Great Visualization of Contour Lines
Gradient

Gradient shows how quickly the value changes from one point to another.
A steep (high) gradient changes quickly and the isolines are close together.
A gentle (low) gradient changes slowly and the lines are far apart.
To make a topographic profile
- Place scrap paper along the line AB on your contour map of the volcano island.
- Put a “tick mark” wherever a contour touches the scrap paper.
- Label the tick mark with the elevation of the contour line.
- Place the scrap paper at the bottom of this sheet.
- Put a dot directly above each tick mark at the elevation that it represents.
Types of Maps
Mercator
- shows true directions (NSEW) as straight lines.
- features near the poles get stretched.
Gnomonic
- shows the shortest distance as a straight line.
- both distance and direction get distorted.
Polyconic- more accurate of the three.
Description of how maps are made |


